EUGENIO / CARRILLO Let’s talk
LAB NOTE / SHIPPED INTERNAL TOOL
SONOVIT REPORT BUILDER

From the audiometer to a ready-to-send report — without rebuilding it in Word.

While redesigning Sonovit’s website, I found a second problem inside the clinic. After each hearing evaluation, results moved through phone photos, handwritten notes and manually formatted Word files. Identical studies could leave the clinic as visibly different reports.

I designed, implemented and deployed an internal tool that captures structured study data, reconstructs the charts and generates a standardized PDF for professional review. The final version launched across both branches in early July 2026.

45–60 min → 15–20 min
From performing the study to sending the final report — estimated by clinic staff
Live since July 2026
Used several times per week in Guadalajara and Zacatecas
Client
Sonovit — two branches
Users
Hearing-care professionals and administrative staff
Role
Product lead & builder
Status
Live in Guadalajara and Zacatecas
Scope Research, workflow, UX/UI, validation logic, AI-assisted implementation, testing and deployment
01
The problem

One study, two different reports.

Inputs arrived in incompatible formats — phone photos of the audiometer, scanned printouts, clinical notes as long paragraphs — and each professional rebuilt the report in their own way.

What was missing wasn’t a better template. The study had no structured form: thresholds existed only inside a photograph, so the values could not be validated, recalculated or compared.

Before8 steps
Run study Send photos & notes Interpret Recreate charts Format document Corrections Create the PDF Send
After5 steps
Run study Capture structured values Review interpretation Approve PDF ready to send
02
The principle

Standardize. Don’t generate.

One rule shaped the architecture: nothing reaches the patient document without first existing as structured, validatable data. That split the workflow into capture, extraction, interpretation and generation.

Clinical wording comes from deterministic rules, not a language model. AI may assist with reading source files and organizing notes, but never writes the conclusion — the professional approves before export. The trade-off: less generative flexibility, more consistency and clinical control.

Resulting architecture
Capture Structure Interpret Professional review Generate PDF
03
Field research & live pilot

The users were two meters away, so I asked them.

I started by interviewing the physicians and hearing-care professionals who perform, interpret and review the studies. Those conversations defined which clinical information to capture, which tests to support, and the parameters and formulas behind each one.

I then piloted the platform for two weeks with four users across both branches, during real consultations — 15 reports before the final release. Their feedback simplified data capture, cut fields the report didn’t need, added autosave, and clarified how accounts and access permissions are managed.

4 participants
Three hearing-care professionals and one administrative user
2-week live pilot
Tested during real consultations, not simulated tasks
2 branches
Different teams, equipment and local workflows
Iteration 01
Observed
Capturing a study required too many fields and forced users to enter information that was not necessary for the interpretation or final report.
Changed
The flow was condensed around the minimum clinical data required for each study, making entry faster and easier to review.
Iteration 02
Observed
Users could move through the workflow without always remembering to save their latest changes.
Changed
Autosave was added throughout the process so progress would not depend on remembering a separate save action.
Iteration 03
Observed
Creating users, assigning access and managing passwords required more flexibility than the first version provided.
Changed
Account creation and deletion were redesigned around clearer roles, temporary passwords and explicit access levels.

I owned the workflow, information architecture, interface, implementation, testing and deployment. Clinical requirements — studies, parameters, formulas and report content — came from interviews with physicians and hearing-care professionals.

04
The product

Five steps that follow the consultation.

The tool was designed for clinical staff who shouldn’t need software training: one primary action per screen, clear progress, plain-language feedback and autosave throughout. The interface follows the consultation rather than asking the clinic to adapt to it.

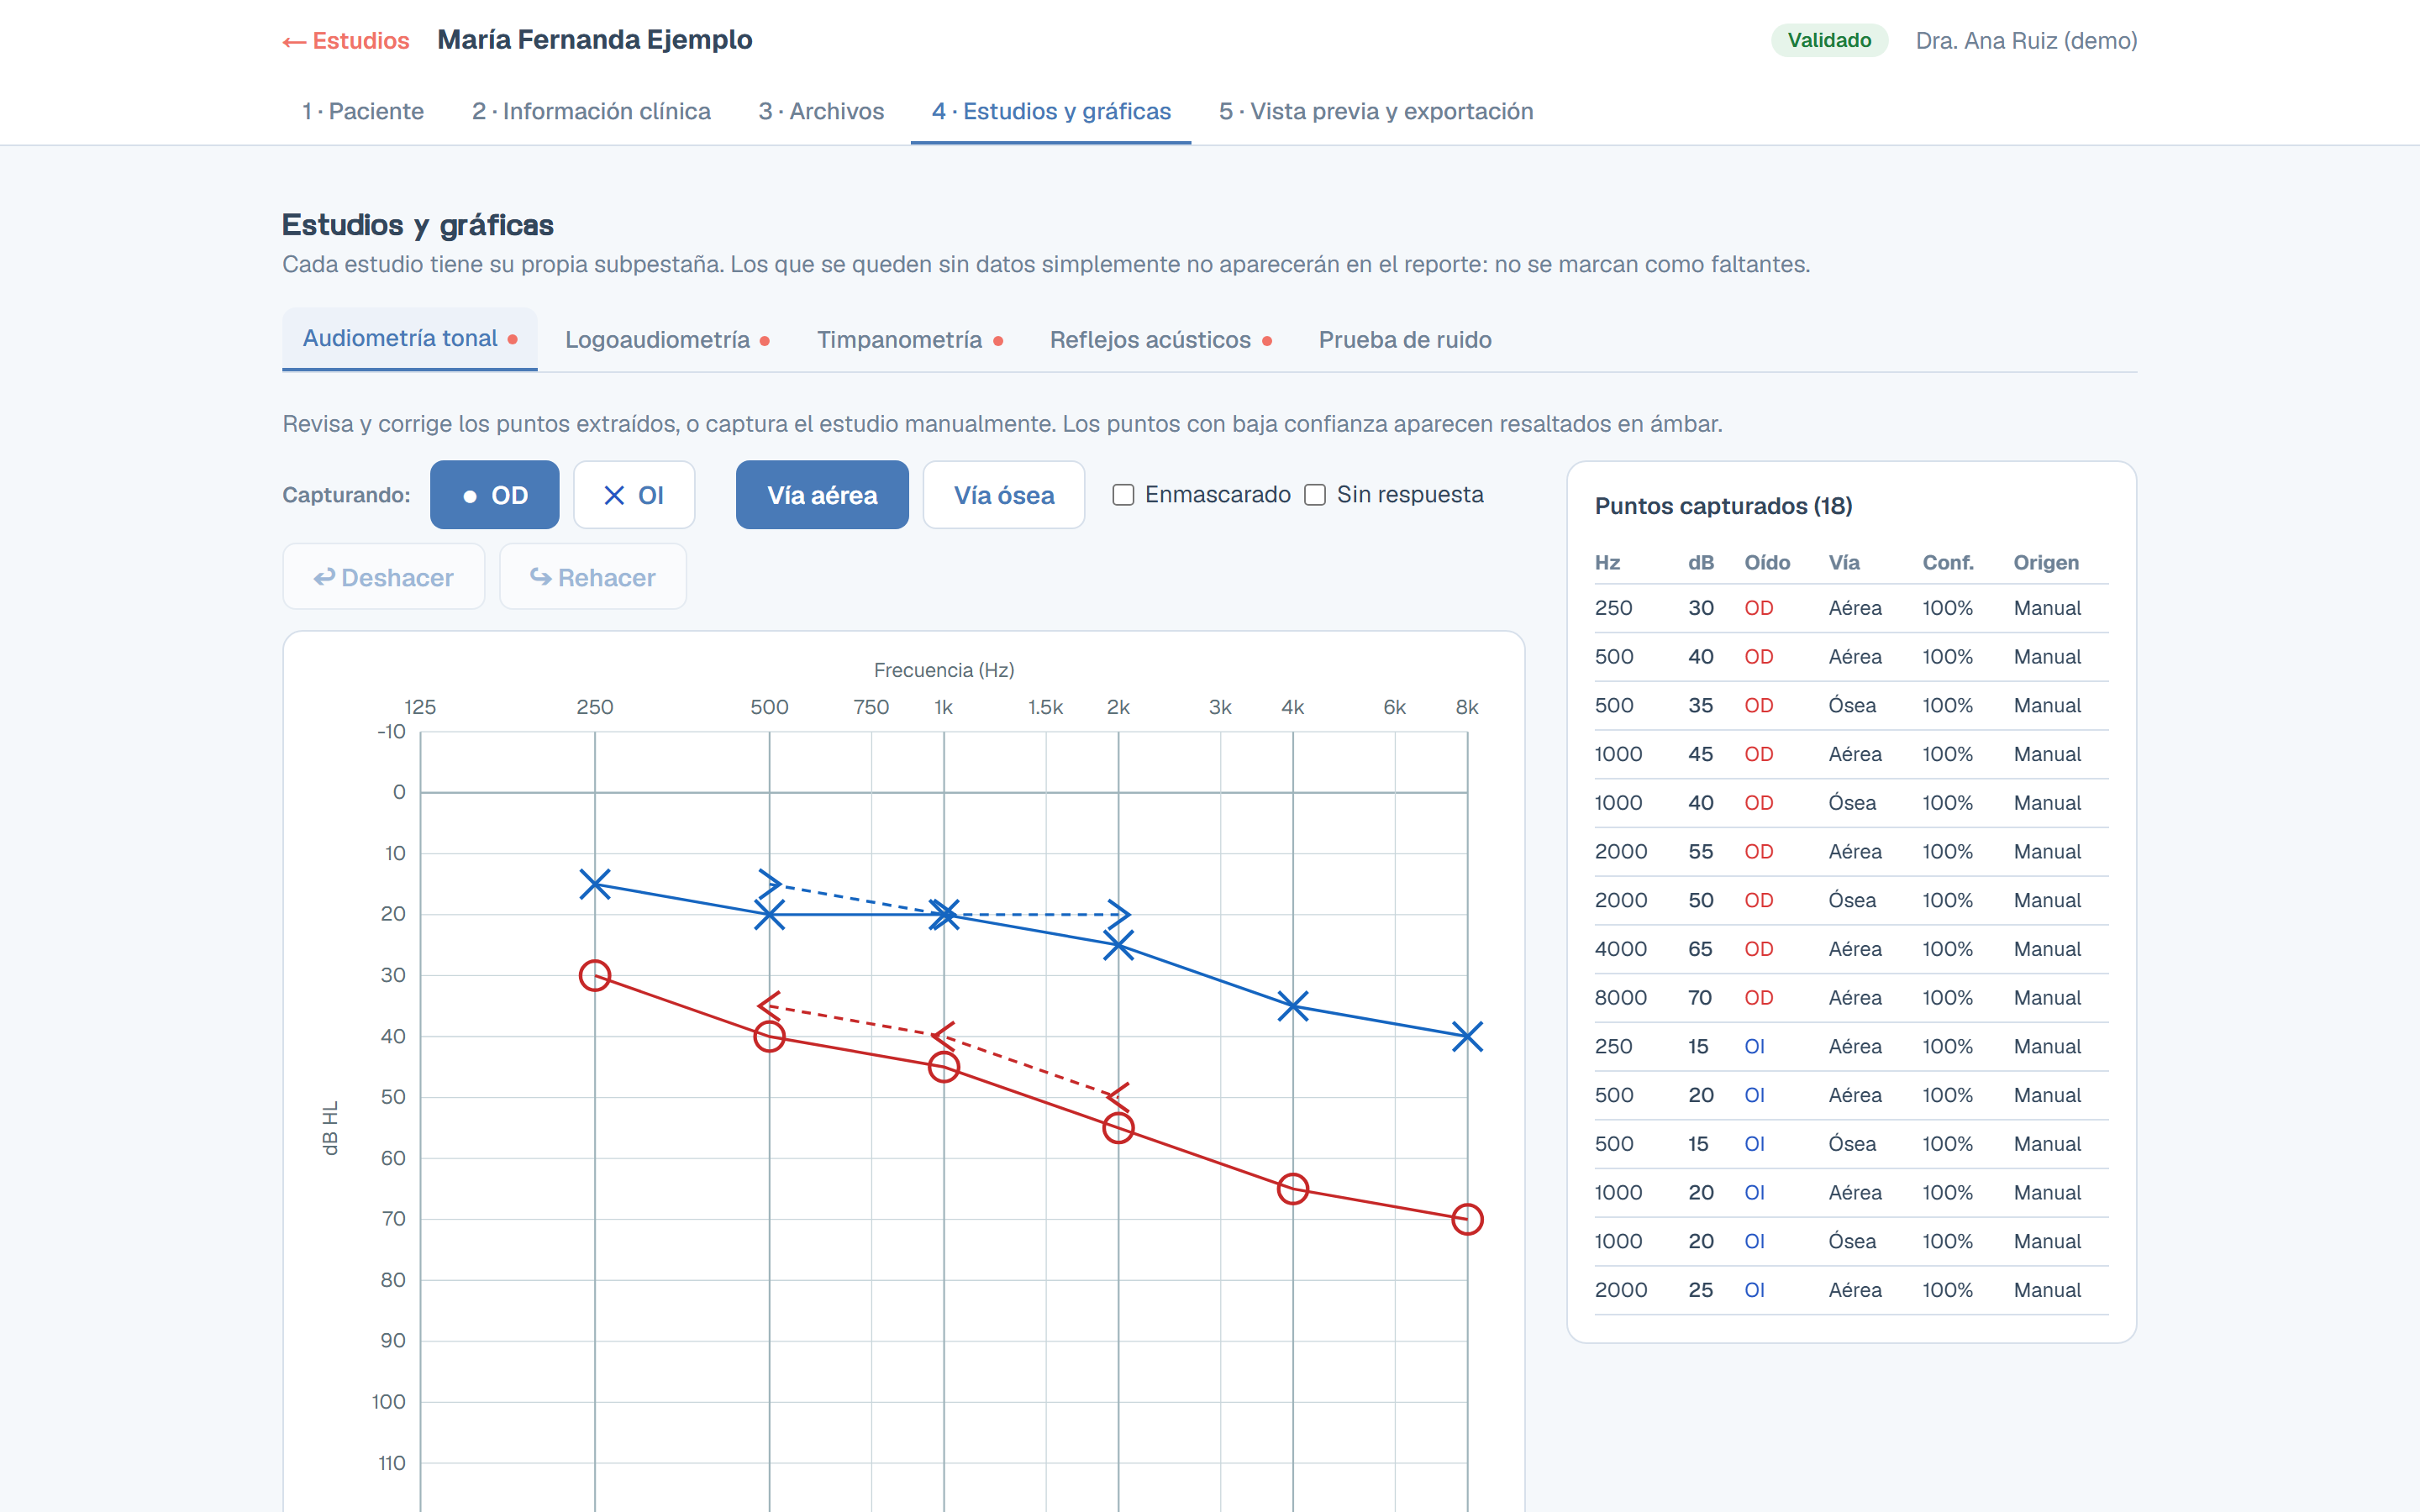
Audiogram editor: five-step progress, capture by ear and conduction, undo and redo, and a table of captured points with confidence and source 1 2 3 4
1Five-step progress, always visible
2Manual correction with undo and redo
3Confidence level and source per captured value
4Professional approval state before export
Studies list with patient, date, branch, status and last edit
01 Draft, pending review and validated studies, readable at a glance.
Patient and clinical information step with only the required fields
02 Only the information required for the study must be completed.
Tympanometry subtab: curves reconstructed from measured parameters
03 Measured parameters in, a clean reconstructed curve out.
Preview and export step: editable interpretation, validation state and export
04 The professional reviews the complete document before export.

All portfolio screens use synthetic demo data. No patient information is shown.

05
Key product decisions

Standardize the repetitive. Protect the clinical.

The difficult decisions were not about automating more. They were about deciding what could be standardized, what still required professional judgment and how the system should behave when information was uncertain.

What wasn’t studied doesn’t appear

A study can be complete for its scope even when some tests weren’t required. Empty sections are dropped from the patient document; missing-data warnings stay inside the tool, where they guide the professional.

Result — A complete report, not a visible list of omissions.

Uncertainty is shown, not filled in

Extracted values keep their confidence level and source. Low-confidence points are highlighted and block validation until reviewed. The system never interpolates missing values to complete a curve.

Result — No unmeasured number reaches the report.

Charts redrawn, never pasted

Audiograms are reconstructed as vectors from stored thresholds using standard symbols. The editor and PDF use the same geometry source.

Result — The preview and exported report always match.

Signing off is an explicit act

Export remains in draft until a professional confirms the data, charts and interpretation. Editing a validated study automatically returns it to review.

Result — Automation supports professional judgment instead of replacing it.

06
The patient deliverable

The document the patient receives.

The interface was only half of the product. The patient receives the PDF, so it needed the same hierarchy, consistency and clinical legibility as the application.

It matches Sonovit’s printed identity, uses vector charts and selectable text, and includes only sections holding real study data. A tonal-audiometry-only evaluation produces a complete two-page report, not one padded with “not evaluated” pages.

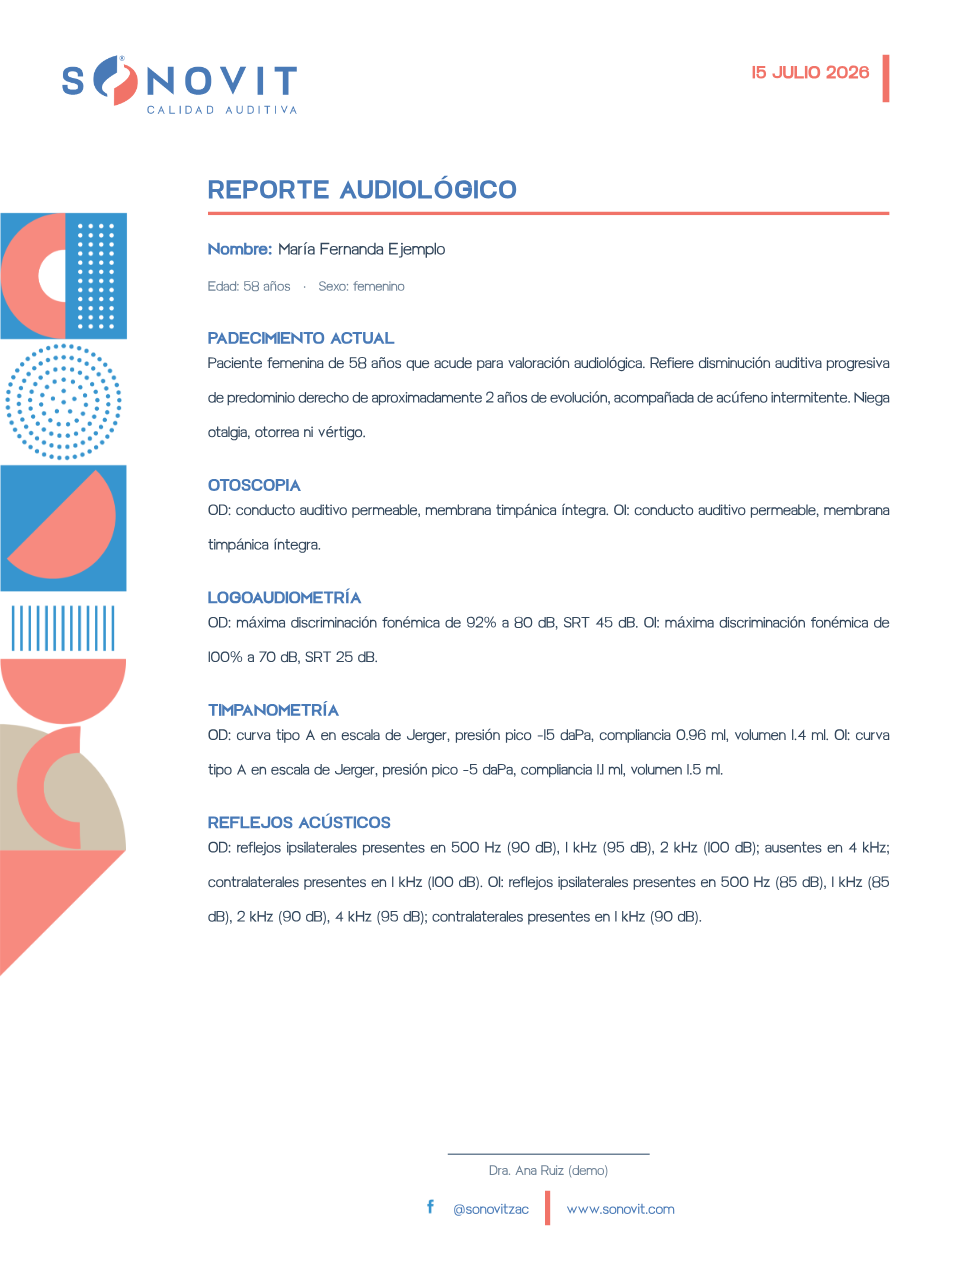
Page one of the audiological report: clinical narrative and patient information
P1 Clinical narrative and patient information
Page two: dual-panel tonal audiograms drawn as vectors, standard symbol legend and PTA per ear
P2 Tonal audiometry reconstructed from structured values
Page three: speech audiometry and tympanometry, present only when those studies hold data
P3 Complementary studies shown only when data exists
Page four: acoustic reflexes table per ear, generated without empty sections
P4 Study-specific pages generated without empty sections

Fictional example patient. Open the full PDF →

07
Shipped impact

From study to report in a fraction of the time.

The final version launched in early July 2026 and is now used several times per week across both branches, often more than once a day. Nobody rebuilds documents from scratch in Word — structured data, reconstructed charts and report rules live in the same workflow.

45–60 min → 15–20 min
Staff estimate, comparing the previous Word workflow with the tool
40 reports
15 during the live pilot and 25 after launch
2 branches
One standardized workflow across Guadalajara and Zacatecas
Observed

The report no longer needs to be manually reconstructed in Word.

Observed

Both branches now produce documents using the same structure, visual system and validation rules.

08
Built & shipped

Technical decisions in service of the clinic.

I designed, implemented, tested and deployed the product end to end with AI-assisted coding tools, against three constraints from the clinic.

C1

Consultations can’t stop when the internet fails.

C2

Files stay local to each branch.

C3

Silent errors must never reach an exported report.

Local-first architecture · one machine per branch Next.js · React · TypeScript · Zod · Prisma · SQLite
Optional — assisted extraction model

Replaceable, able to stay on site. With no model configured the full workflow still runs in manual mode.

Optional input
Branch 01 Guadalajara
Interface capture & review
Rules validation & interpretation
Data local database
Report PDF generation
Branch 02 Zacatecas
Interface capture & review
Rules validation & interpretation
Data local database
Report PDF generation

Each branch runs the same stack on its own machine, available across the internal network — data, charts and PDF generation stay local, so a poor connection never stops a consultation. Trade-off: records are not synchronized between locations automatically.
Role-based access per user
Audit history on important actions
Automated checks from capture to PDF
Owned end to end
  • Problem definition
  • Workflow & information architecture
  • Interface & validation behavior
  • Implementation, testing, deployment
AI-assisted
  • Writing implementation code
  • Reading source files, when configured
  • Organizing captured information
  • Never: the clinical conclusion

The clinical requirements did not come from the model. Studies, parameters, formulas and report content came from the physicians and hearing-care professionals who perform and interpret them — and deterministic rules plus professional review decide what reaches the final report.

Still Sonovit-specific — some values need manual capture, and the rules, report structure and clinical configuration were built for this clinic rather than as a configurable product.

09
What I learned

The document mattered as much as the app.

The report is what the patient keeps and what represents the clinic, so its hierarchy, charts and pagination needed the same design attention as the interface.

Shipping it also changed my judgment as a designer. Watching real consultations taught me more about required fields, error copy, permissions and autosave than reviewing the flow on my own screen ever could.